Plate Nº 77 · recorded October 15, 2026
Earth & ClimateReported finding
NASA Satellites Track What May Be the Strongest El Niño Since 1950
NOAA puts an 83% chance on the strongest El Niño since 1950 unfolding now. NASA satellites watch seas rise 40 cm, waters warm 1.7°C, and the Pacific turn blue.
By Elena Vasquez5 min read1,016 words
In brief
- NOAA estimates an 83% chance the strongest El Niño since 1950 is underway, as of October 2026
- Eastern Pacific sea surface temperatures are about 3°F (1.7°C) above the long-term average
- Sea levels in parts of the eastern Pacific have risen 30–40 cm (1–1.3 ft); the first Kelvin wave appeared in January 2026
- This is the first El Niño observed by NASA's PACE satellite, launched in 2024
- Satellite altimetry has tracked ocean height continuously since 1993, now via Sentinel-6
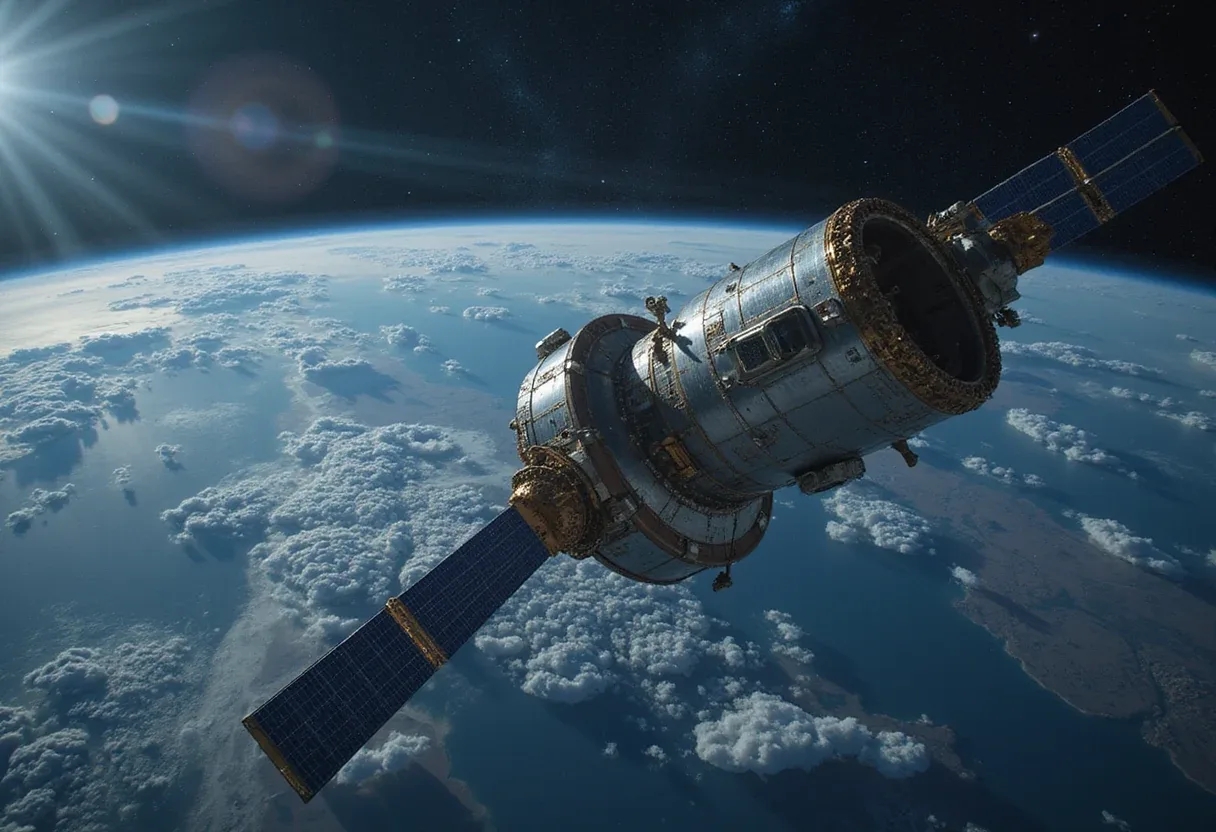
There is an 83% chance that the strongest El Niño since 1950 is unfolding right now, according to the National Oceanic and Atmospheric Administration (NOAA) — and NASA's satellite fleet is tracking it from space.
As of October 2026, the eastern equatorial Pacific is running about 3 degrees Fahrenheit (1.7 degrees Celsius) warmer than the long-term average. Farmers, firefighters, and coastal communities around the world are already feeling the effects.
El Niño is a natural climate pattern that shows up roughly every two to seven years, marked by warmer-than-normal water in parts of the equatorial Pacific. NASA ranks it as rarer than a solar eclipse and more powerful than any single storm system. It flips trade winds, redistributes ocean heat, scrambles rainfall, and raises sea surface height across parts of the Pacific.
Here's what the satellites are seeing, piece by piece.
How did this El Niño get started?
The first clue appeared in January 2026. Satellite imagery spotted a Kelvin wave — a slow-moving pulse of warm water thousands of miles long — near Micronesia in the western Pacific.
Kelvin waves work like underwater freeways, hauling heat from west to east across the ocean. The warm water heats the air above it, and that air rises. The shift in pressure weakens or even reverses the trade winds that normally blow from the Americas toward Asia. Sea levels in the eastern Pacific rise further, waters warm even more, and the chain reaction marks the start of an El Niño.
By early April, those Kelvin waves had reached the eastern Pacific and sea surface temperatures had begun to climb. Warm water expands, lifting local sea levels in some areas by as much as 1 to 1.3 feet (30 to 40 centimeters). The bulge sloshed toward South America and then moved up the coast toward California. Around Indonesia and northern Australia, sea levels sat six to eight inches (15 to 20 centimeters) below normal.
"Kelvin waves are like the heartbeat of El Niño," said Josh Willis, project scientist for sea level missions at NASA's Jet Propulsion Laboratory in Southern California. "And our sea level satellites let us peer into the ocean and watch every beat."
Scientists have tracked ocean height by satellite altimetry — radar measurements of the sea surface — without interruption since 1993. The Sentinel-6 satellites carry on that record today, with radar altimeters that survey millions of square miles of ocean in a single day, down to fractions of an inch. They complement NOAA's buoys and ocean sensors in the water below.
In short: satellites caught this El Niño in the act, from its first warm pulse to its arrival at South America's doorstep.
How warm is the Pacific getting?
About 1.7 degrees Celsius above normal so far, and possibly more to come. Willis said temperatures could jump another fraction of a degree in the coming months.
Satellites carrying microwave and infrared radiometers — instruments that measure heat energy at the sea surface and can see through and around clouds — mapped the band of warmer-than-normal water as it expanded through spring 2026. That band, visible in dark red on NASA's maps, stretches for millions of square miles from the heart of the Pacific to the coast of South America.
The temperature matters beyond the ocean itself. Air above the water's surface carries heat and moisture into the atmosphere, seeding rainstorms and rearranging weather patterns across the globe.
Warm water, in other words, is the engine — and the whole world sits downstream of it.
Why is the ocean turning blue?
El Niño's warm waters are also changing the ocean's color, and a NASA satellite is watching it happen.
"Some people think of water as being just blue, but it's amazing the multitude of colors the ocean can be," said Matthew Kehrli, a lead research scientist for the PACE (Plankton, Aerosol, Cloud, ocean Ecosystem) satellite team at NASA's Goddard Space Flight Center in Greenbelt, Maryland.
Much of that spectrum comes from phytoplankton — microscopic plants that anchor the marine food web and come in thousands of species, in shades of teal, brown, and green. Normally, equatorial Pacific waters are lush with them and greener as a result. Over the last several months, those green hues have waned, and the water has become measurably bluer.
This is expected El Niño behavior. Phytoplankton thrive in cool, nutrient-rich water. During an El Niño, weakened trade winds reduce the upwelling of nutrient-rich deep water to the surface. With less food, phytoplankton numbers drop. The decline can cascade through the marine food web, forcing other sea life to hunt for new feeding grounds.
This is the first El Niño since PACE launched in 2024, giving scientists fresh eyes on the phenomenon. The satellite's Ocean Color Instrument observes the ocean in hyperspectral color — across several hundred wavelengths of visible, near-infrared, and ultraviolet light — and monitors phytoplankton shifts in near-real time. Researchers boil those spectra down to a single number called the apparent visible wavelength.
The 2026 maps show the green equatorial band shrinking as blue fills in; 2025's maps, from a weak La Niña year, show the green holding steady.
"You have expectations of what you would think would happen," Kehrli said. "But to visually see the results with the data products that you're working with in real time is gratifying."
The bottom line: even the ocean's color is a climate signal, and this year it's flashing blue.
What happens next?
NASA scientists will keep monitoring the signs and impacts of this El Niño with its fleet of Earth-observing satellites. One caveat worth noting: the 83% figure is a probability, not a verdict — forecasts of a record event can still shift as conditions evolve.
"El Niño touches almost all of us in some way every time it occurs," Willis said. "While many have seen what it can do, we look to the ocean to understand why."
NASA has posted the data visualizations from this story for public viewing and download.
via cpc.ncep.noaa.gov (Original)
More from Elena Vasquez
Show full bio
Correspondent covering money, funding and market shifts around general science news at SciBeat.
242 articles
Nearby plates
- Amazon Smoke Chokes Manaus as El Niño Fire Season Ignites Early
- Antarctica Gained 695 Billion Tons of Ice. The Trigger Was Thousands of Miles Away
- Arctic Sea Ice Ties for 10th-Lowest Minimum in 2026 Satellite Record
- Global Warming Is Breaking a 400-Year Climate Link Between Two Oceans
- Atlantic's Climate-Regulating Current Has Weakened for 20 Years