Plate Nº 19 · recorded October 16, 2026
Earth & ClimateReported finding
Antarctic Sea Ice Hits Third-Lowest Winter Peak on Record
Antarctic sea ice peaked at 17.59 million square kilometers on September 14, 2026 — the third-lowest winter maximum in the satellite record, extending a decline that began in 2016.
By Priya Raman3 min read663 words
In brief
- Antarctic sea ice reached its 2026 winter maximum on September 14 at roughly 17.59 million square kilometers, the third-lowest on record.
- Between 1979 and 2014, Antarctic sea ice increased about 1 percent per decade, with record highs from 2012 to 2014.
- 2023 saw both the lowest summer minimum and lowest winter maximum since satellite observations began.
- The continuous satellite record started in late 1978 with NASA's Nimbus-7 spacecraft.
- Scientists measure sea ice extent using a 15 percent ice-coverage threshold counted by passive microwave sensors.
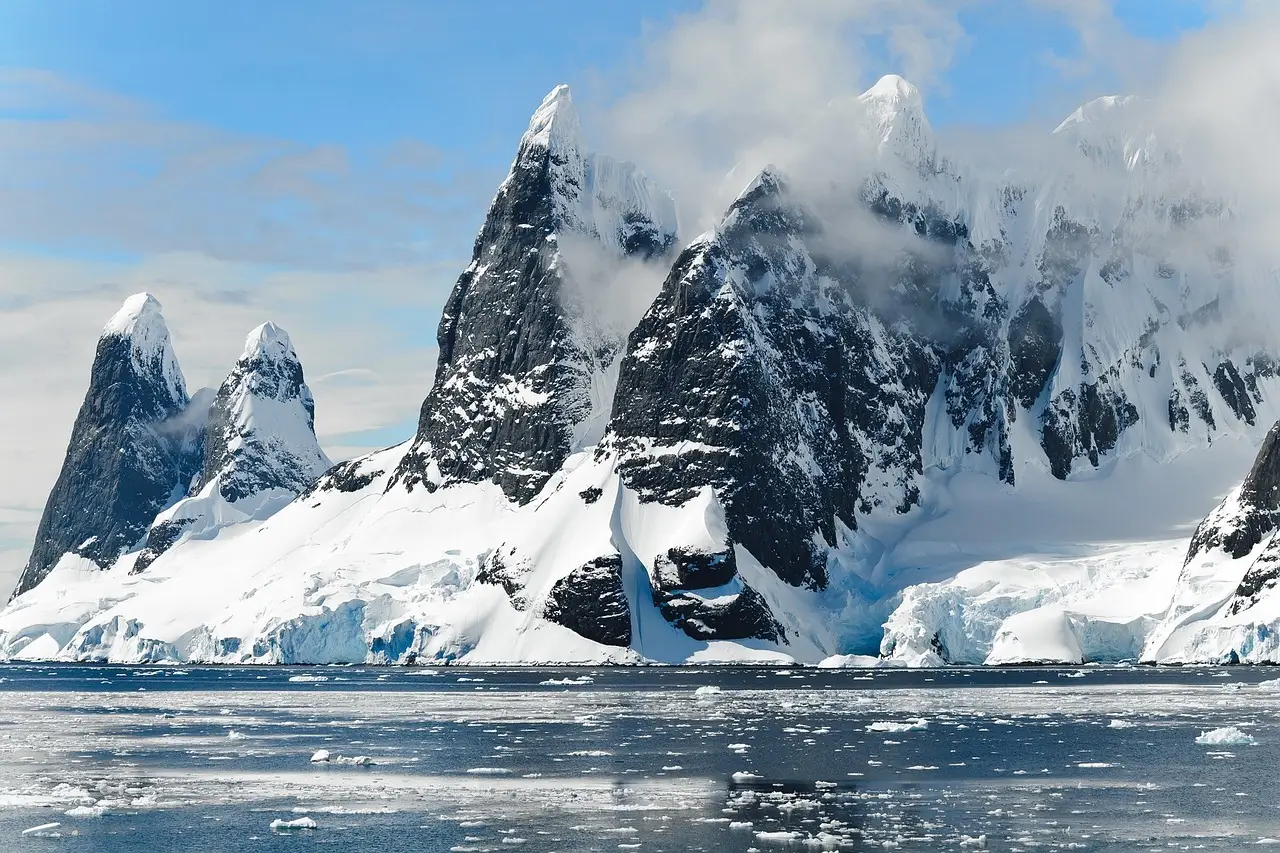
Antarctic sea ice reached its winter maximum on September 14, 2026, covering approximately 17.59 million square kilometers (6.79 million square miles) of ocean — the third-lowest winter peak since satellite measurements began in the late 1970s. NASA and the National Snow and Ice Data Center (NSIDC) reported the measurement, which extends a decline that began abruptly in the middle of the last decade.
For a scientist watching the satellite maps, the pattern is striking. The image released by NASA's Earth Observatory shows ice concentrations at the September peak, and the picture they reveal sits near the bottom of a record that stretches back nearly half a century.
Why does Antarctic ice peak in September?
Antarctica differs from the Arctic in one fundamental way. The Arctic is an ocean basin enclosed by land; Antarctica is a continent surrounded by open ocean. That geography gives winter sea ice room to spread outward over enormous distances during the Southern Hemisphere's winter.
The same openness carries a cost. Spreading outward pushes the ice into warmer latitudes, where summer melting becomes more likely. As a result, Antarctic sea ice generally reaches its largest extent in September and shrinks to its annual minimum in February.
When researchers calculate "sea ice extent," they count only areas where ice covers at least 15 percent of the water surface. That threshold separates genuinely frozen regions from scattered floes.
What changed after decades of growth?
For decades, Antarctic sea ice appeared to move in the opposite direction from the rapidly shrinking Arctic. Between 1979 and 2014, sea ice extent around Antarctica increased by approximately 1 percent per decade. Because Antarctic ice coverage fluctuates considerably from year to year, researchers remained uncertain whether the gradual increase reflected a meaningful long-term change.
The expansion peaked dramatically between 2012 and 2014, when Antarctic winter sea ice set new record highs for three consecutive years — a stark contrast to the steep decline under way at the opposite pole.
Then the trend ended in 2015. Beginning in 2016, the region experienced substantial losses in sea ice coverage. Some years have brought modest recoveries, but Antarctic sea ice has generally remained below its historical average since then.
The most extreme conditions occurred in 2023, when Antarctica recorded both its lowest summer minimum and its lowest winter maximum in the satellite era. The 2026 measurement adds another significant data point to that record.
Is this a permanent shift or natural variability?
Scientists do not yet know. Researchers continue to track the ice each year to determine whether the post-2016 declines represent a lasting transformation in Antarctic sea ice or fall within the range of statistical variability. The unusually low maximum in 2026 is consistent with the recent pattern, but a single year cannot settle the question. The natural year-to-year fluctuation that once obscured the earlier growth trend now complicates any declaration of a new normal.
How do satellites see ice through clouds?
The entire record rests on instruments called passive microwave sensors. Rather than relying on visible light, these sensors detect microwave energy that Earth's surface emits naturally. Sea ice produces a stronger microwave signal than open ocean water, letting researchers distinguish frozen from ice-free areas.
The approach has one decisive advantage: microwaves pass through clouds. Conventional satellite cameras cannot see the surface under thick cloud cover, but microwave sensors can observe the ice repeatedly, in any weather.
The record began in late 1978 with NASA's Nimbus-7 spacecraft:
- 1978: Nimbus-7 starts the continuous satellite record
- 1987: satellites under the Defense Meteorological Satellite Program (DMSP) add measurements
- 2002–2011: NASA's Aqua satellite contributes data
- 2025: researchers begin incorporating observations from the Japan Aerospace Exploration Agency's GCOM-W satellite
That layered succession of spacecraft has maintained an unbroken, decades-long record — the one instrument scientists now rely on to judge whether Antarctica's frozen waters have truly turned.
The ice will tell, one September at a time.
via science.nasa.gov (Original)
More from Priya Raman
Show full bio
Senior reporter covering people, launches and day-to-day practice in general science news at SciBeat.
242 articles
Nearby plates
- Arctic Sea Ice Ties for 10th-Lowest Minimum in 2026 Satellite Record
- Arctic Melt Season Grew 40 Days Longer Since 1979—Then Stalled in 2010
- Antarctica Gained 695 Billion Tons of Ice. The Trigger Was Thousands of Miles Away
- Slow waves deep inside Earth helped Antarctica freeze first
- Arctic Ice Trapping a NOAA Ship Was Forecastable, Scientists Say