Plate Nº 30 · recorded November 14, 2026
Earth & ClimateReported finding
Five Data Sets, Five Answers: The Uncertainty Behind Nitrogen Pollution Maps
A UC Davis study finds five Central Valley data sets yield sharply different nitrogen surplus estimates, potentially reshaping groundwater protection priorities.
By Priya Raman3 min read674 words
In brief
- The study was published in Nature Sustainability in 2026 (DOI: 10.1038/s41893-026-01992-8).
- The Central Valley uses five data sets to estimate nitrogen surplus; most of the U.S. uses only one or two USDA sources.
- Uncertainty ranges were wide enough to potentially change which crops and regions get priority for groundwater protection.
- One data set compared, CDFA county records, has been collected annually since the early 1900s.
- Corresponding author Thomas Harter's 2012 research helped shape California's nitrogen management strategies.
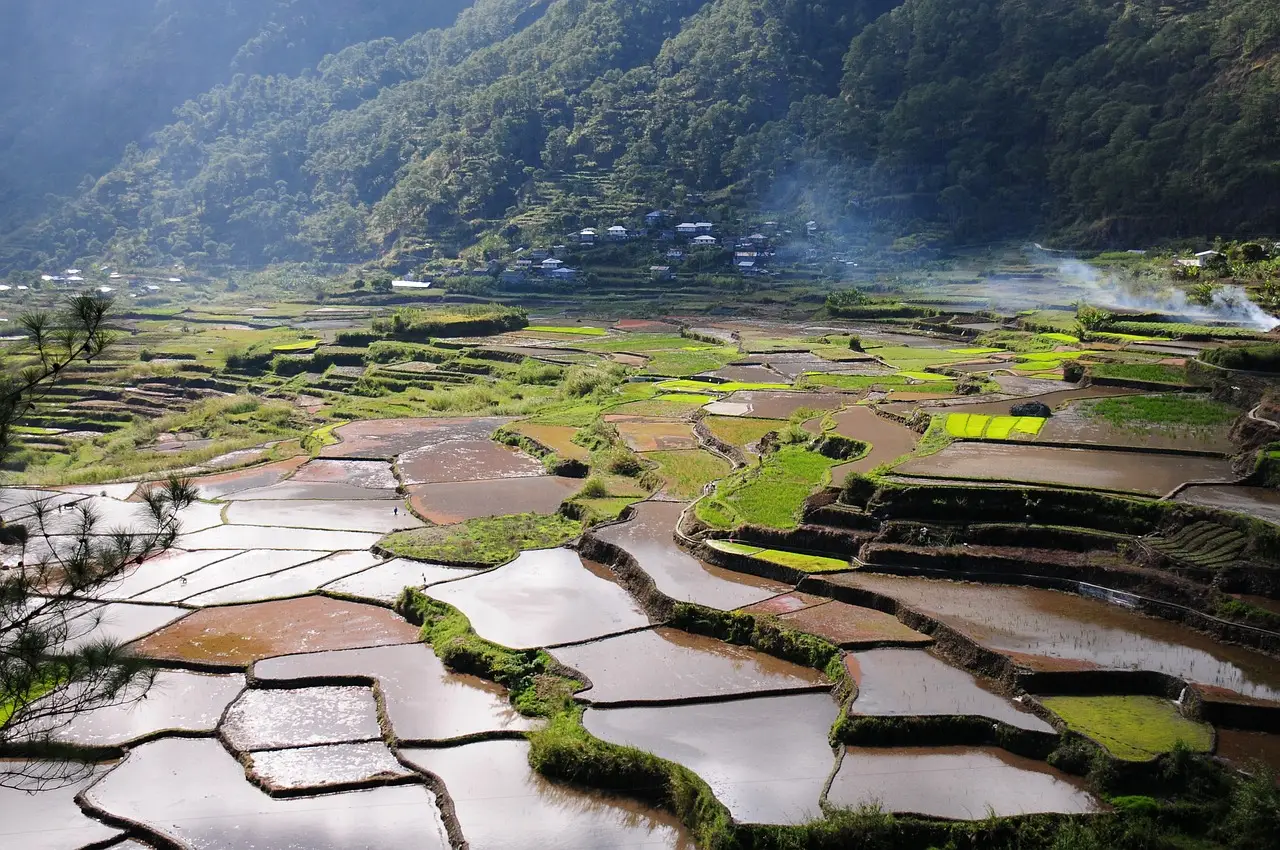
A single farm can look like it needs aggressive nitrogen cleanup under one data set and barely any under another. That is the central finding of a new University of California, Davis study, published in the journal Nature Sustainability, which compared five separate agricultural data sets across California's Central Valley and found that each produced significantly different estimates of surplus nitrogen (the amount of nitrogen fertilizer and livestock waste left over in the environment after crops take up what they need).
The stakes are considerable. The range of uncertainty was so wide, the researchers found, that it could reshape which crops and which regions receive priority for groundwater protections.
How do you measure nitrogen surplus?
To reduce nitrogen pollution from synthetic fertilizer and livestock waste, California's Central Valley relies on five distinct data sets. Most of the rest of the United States leans on just one or two: the U.S. Department of Agriculture's agricultural survey and census.
The UC Davis team, coordinated by postdoctoral researcher Baibaswata Bhaduri, used the Central Valley as a "living laboratory" and compared all five sources:
- The USDA's agricultural survey and census data
- Grower-reported records of total nitrogen applied and crop yields, which each farm now reports annually under California's recent nitrogen tracking policy
- UC Davis Cost and Return Studies, which provide expert estimates of crop-specific fertilizer rates and yields
- The California Department of Food and Agriculture's annual crop-specific acreage and harvest records, collected and reported by county agencies each year since the early 1900s
The study offers ranges of surplus nitrogen for crops from tomatoes and nectarines to corn and grapes. Growers worldwide can consult these estimates for guidance where no local data exist.
What does the disagreement mean for policy?
The same farm or crop could appear to need less mitigation under one data set and more under another, the report found. That matters because conservation money and regulatory attention flow according to such maps.
"We're saying, be cautious," said Thomas Harter, the study's corresponding author and a Cooperative Extension specialist and professor in the UC Davis Land, Air and Water Resources department. "Inevitably, between the various existing data sets, there can be large differences with respect to surplus that could rearrange the shape of your map and where you want to prioritize your conservation efforts. We must take into account the uncertainty in current data about fertilizer use and harvest. Improving data accuracy by engaging with farmers is critical."
Harter is no newcomer to the issue. His 2012 research called attention to nitrogen groundwater pollution and helped set the stage for California's nitrogen management strategies. Of the new paper, he said: "Our paper confirms the approach that California nitrogen policy is pursuing."
Is the Central Valley an outlier?
The authors argue the opposite. "The Central Valley is not a rare place with a rare problem," they wrote in the study. "It is one of the few places with enough data to see a problem that single-data-set assessments carry everywhere, unseen."
In other words, the disagreement visible in California likely exists, invisibly, wherever analysts rely on a single data set. Bhaduri put it plainly: "Disagreement between data sets is not just a limitation; it reveals where our knowledge is weakest. Understanding those differences is essential to improving nitrogen assessments and ensuring that groundwater protection decisions are scientifically defensible and fair to the farmers and communities affected."
The study carries caveats. It examines one region in depth, and its estimates are ranges rather than precise figures, precisely because the underlying data diverge. Still, the finding that data source choice acts as a dominant control on nitrogen surplus uncertainty suggests that better numbers, gathered in cooperation with farmers, may matter as much as better policy.
The paper is published as Baibaswata Bhaduri et al., "Agricultural data source choice as a dominant control on nitrogen surplus uncertainty," Nature Sustainability (2026), DOI: 10.1038/s41893-026-01992-8.
Where the data disagree, the ground truth does not.
via phys.org/rss-feed/ (Source)
More from Priya Raman
Show full bio
Senior reporter covering people, launches and day-to-day practice in general science news at SciBeat.
387 articles
Nearby plates
- Half the Groundwater Sustaining US Produce Isn't Coming Back
- U.S. Irrigation Avoids 6.86 Gigatons of Emissions via Spared Land
- NASA Will Fly Low Over Texas Farmland to Sniff Livestock Emissions
- Dry climates amplify river nitrate beyond human inputs
- Nitrogen's Effect on Soil Respiration Flips Over Time, Study Finds