Plate Nº 11 · recorded October 26, 2026
Earth & ClimateReported finding
NASA Satellite Tracks Fall Foliage Redness Daily Across Entire Planet
NASA's PACE satellite is the first to measure red, yellow and green leaf pigments worldwide every day or two, tracking fall color from orbit — and asking the public for photos to check its work.
By James Calloway4 min read760 words
In brief
- PACE's OCI instrument observes Earth daily at 286 spectral bands, measuring anthocyanins, carotenoids and chlorophylls globally every day or two — a first for any satellite.
- Red foliage peaked in New England, northern Canada and northern Russia from September 29 to October 4, 2026, then shifted south into the Mid-Atlantic, Mongolia and northern China from October 5 to 11.
- Landsat 9 captured peak red foliage around Ripton, Vermont on October 3, 2026.
- NASA is asking the public to submit foliage photos via the GLOBE North America Phenology Campaign to ground-truth the satellite.
- High redness in farm regions of Brazil, Australia and Canada reflects crop stress and harvest, not autumn color.
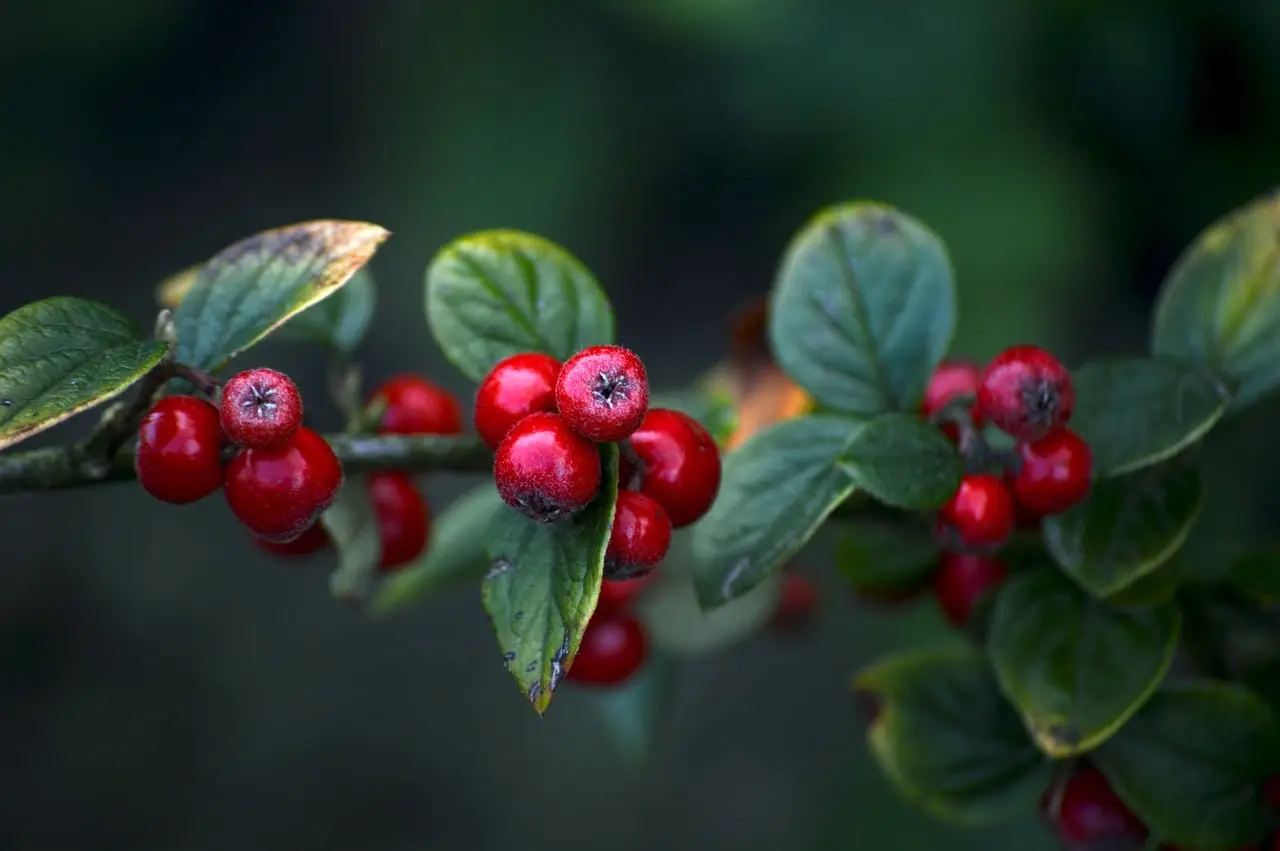
A NASA satellite can now measure all three key leaf pigments — the reds, yellows and greens of autumn — across the entire planet every day or two, something no earlier satellite could do. The instrument is the OCI (Ocean Color Instrument) aboard the PACE satellite, and between September 29 and October 11, 2026, it watched fall color peak in New England, fade there, and push south into the Mid-Atlantic, Mongolia and northern China.
The maps NASA released show vegetation "redness" as a simple ratio: how much red light forests reflect compared with green. Green areas score near 1, meaning leaves haven't turned. Yellow and red areas mean more red pigment relative to green. From September 29 to October 4, the satellite caught the highest redness in northern and eastern Russia, northern Alaska and northern Canada. A week later, that signal had slid toward the equator.
Not everything red is a maple in its glory, though. NASA is upfront about the noise. Crops in some agricultural regions show high anthocyanin levels — red pigment — as they age or after harvest. Clouds punch apparent holes in the vegetation data. So the pretty global map is part foliage report, part artifact.
How does a satellite see leaf color?
The OCI observes Earth's oceans and vegetation daily at 286 spectral bands — narrow slices of the light spectrum. Among them sit wavelength groups sensitive to subtle shifts in leaf pigments: anthocyanins (reds), carotenoids (yellows and oranges) and chlorophylls (greens).
The underlying biology is old news. Chlorophyll, the green molecule plants use to make food, is unstable. Plants must rebuild it constantly, which takes sunlight and warmth. As autumn days shorten and temperatures drop, chlorophyll fades, and the other pigments finally get their moment.
Karl Huemmrich, a vegetation scientist with the Goddard Earth Sciences Technology and Research II center at the University of Maryland, Baltimore County, and a PACE science team member, said the payoff is repetition at global scale. "It's the ability to collect time-series data of anthocyanins and carotenoids everywhere on Earth repeatedly that is game-changing," he said. "The time-series data allow us to determine peak redness and yellowness anywhere on Earth."
Other hyperspectral satellites can measure foliage pigments similarly, but only over localized areas and less often. PACE is the first with this global, near-daily reach. A caveat follows every promise, though: the data are young, and the team is still working out what the redness signal means in places where autumn isn't the driver.
Why is the map so red in some odd places?
NASA data scientist Skye Caplan has been posting weekly redness maps through the GLOBE program's North American Phenology Campaign. The maps show red waves emerging at high latitudes in August and shifting equatorward through September and October.
But PACE also measures high redness in agricultural regions of Brazil, Australia and Canada that don't track seasonal change. "Changes in pigments can also occur when vegetation is stressed due to drought or insect damage," Caplan said. That's the skeptic's caution in one sentence: red can mean autumn, or it can mean a plant in trouble.
The reddest U.S. spots make sense. The Adirondacks, Vermont's Green Mountains and New Hampshire's White Mountains hold large stands of sugar maples and red maples, trees that turn brilliant crimson. In northern Alaska, Canada and Russia, blueberries, bilberries, sedges, mosses and grasses likely drive the tundra reds. Landsat 9 caught the Vermont peak directly — an October 3, 2026 image of intense red around Ripton, the town where poet Robert Frost kept a farm and taught at Middlebury's Bread Loaf School of English.
What does this change for you?
If you enjoy foliage, the weekly maps offer a leaf-peeper's cheat sheet. If you want to help, NASA is asking the public to submit fall foliage photos to "ground truth" the satellite — checking its readings against reality. "The more photos we can get from the ground, the better," Caplan said. You don't need a forest; scientists also want shrubs, grasses, wildflowers, evergreens and crops.
The research ambitions are bigger: how the timing of spring greening and fall senescence is shifting, how vegetation affects the global carbon cycle, how leaf color relates to wildfire risk, and whether PACE can flag early drought, insect infestations or plant disease. Those are hopes, not results, at this stage.
Caplan's advice for contributors is blunt: don't wait. "Color changes happen kind of slowly, then all at once, and then they're gone."
via education.nationalgeographic.org (Original)
More from James Calloway
Show full bio
Staff writer covering regulation, policy and their impact on general science news at SciBeat.
267 articles